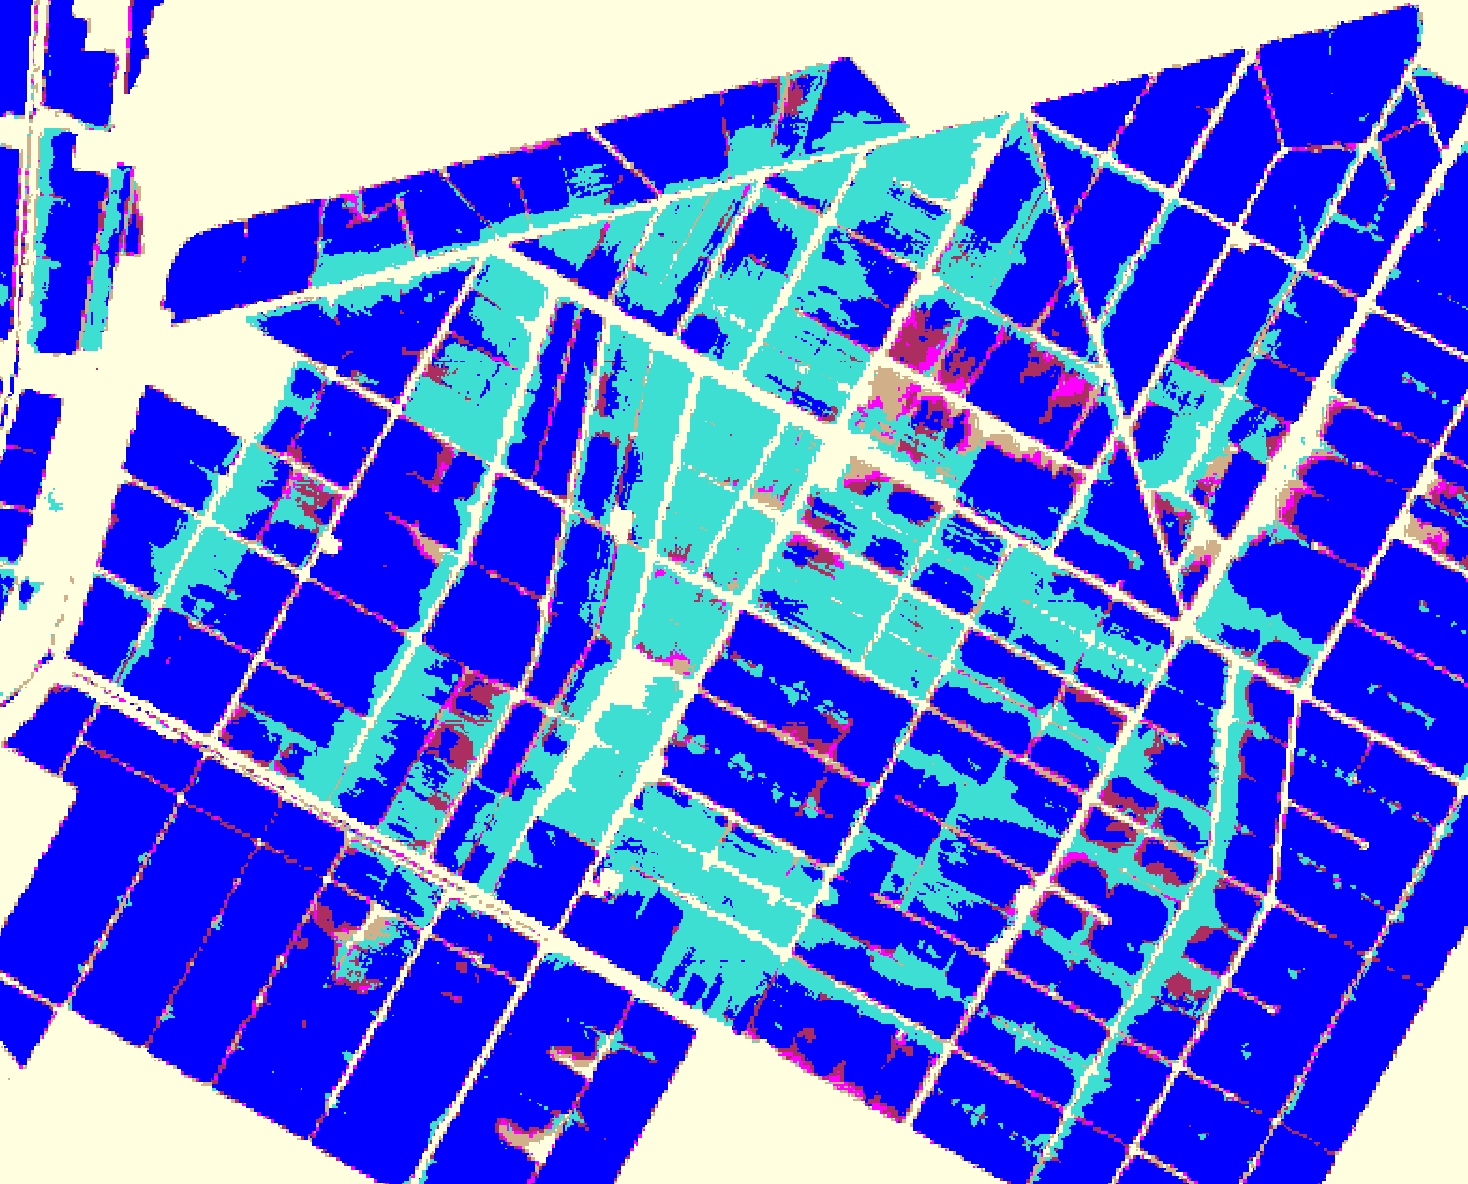


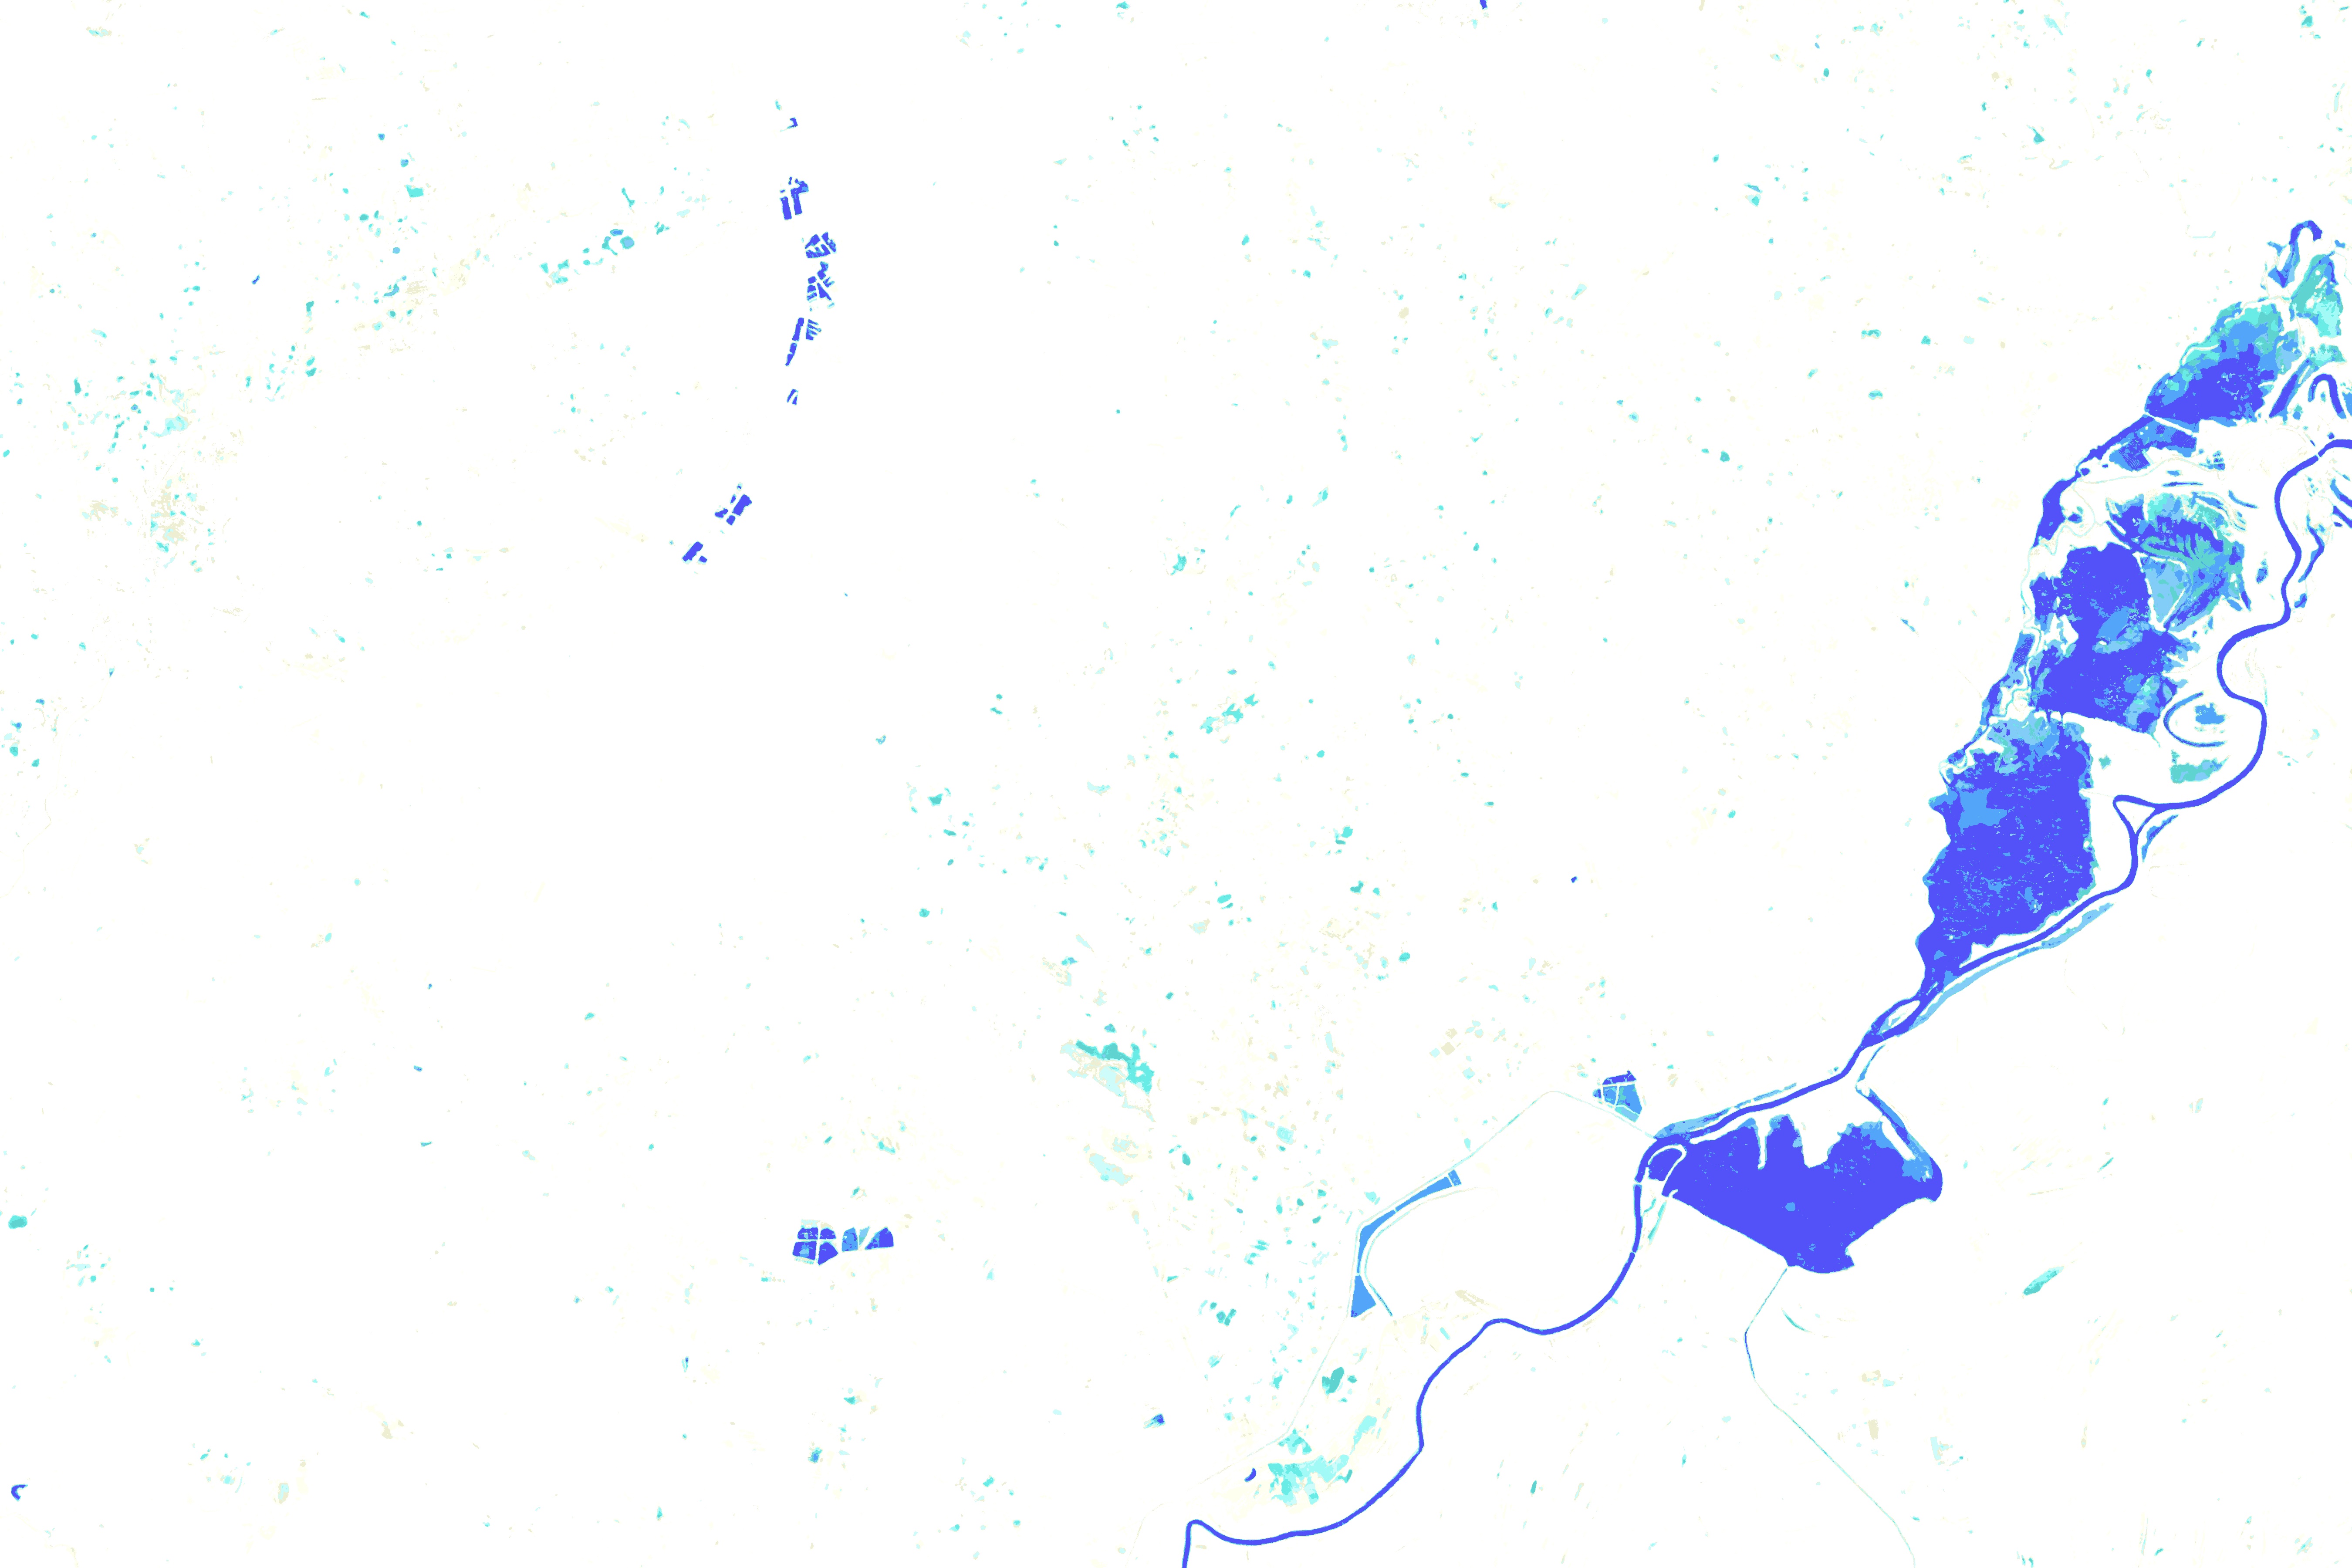
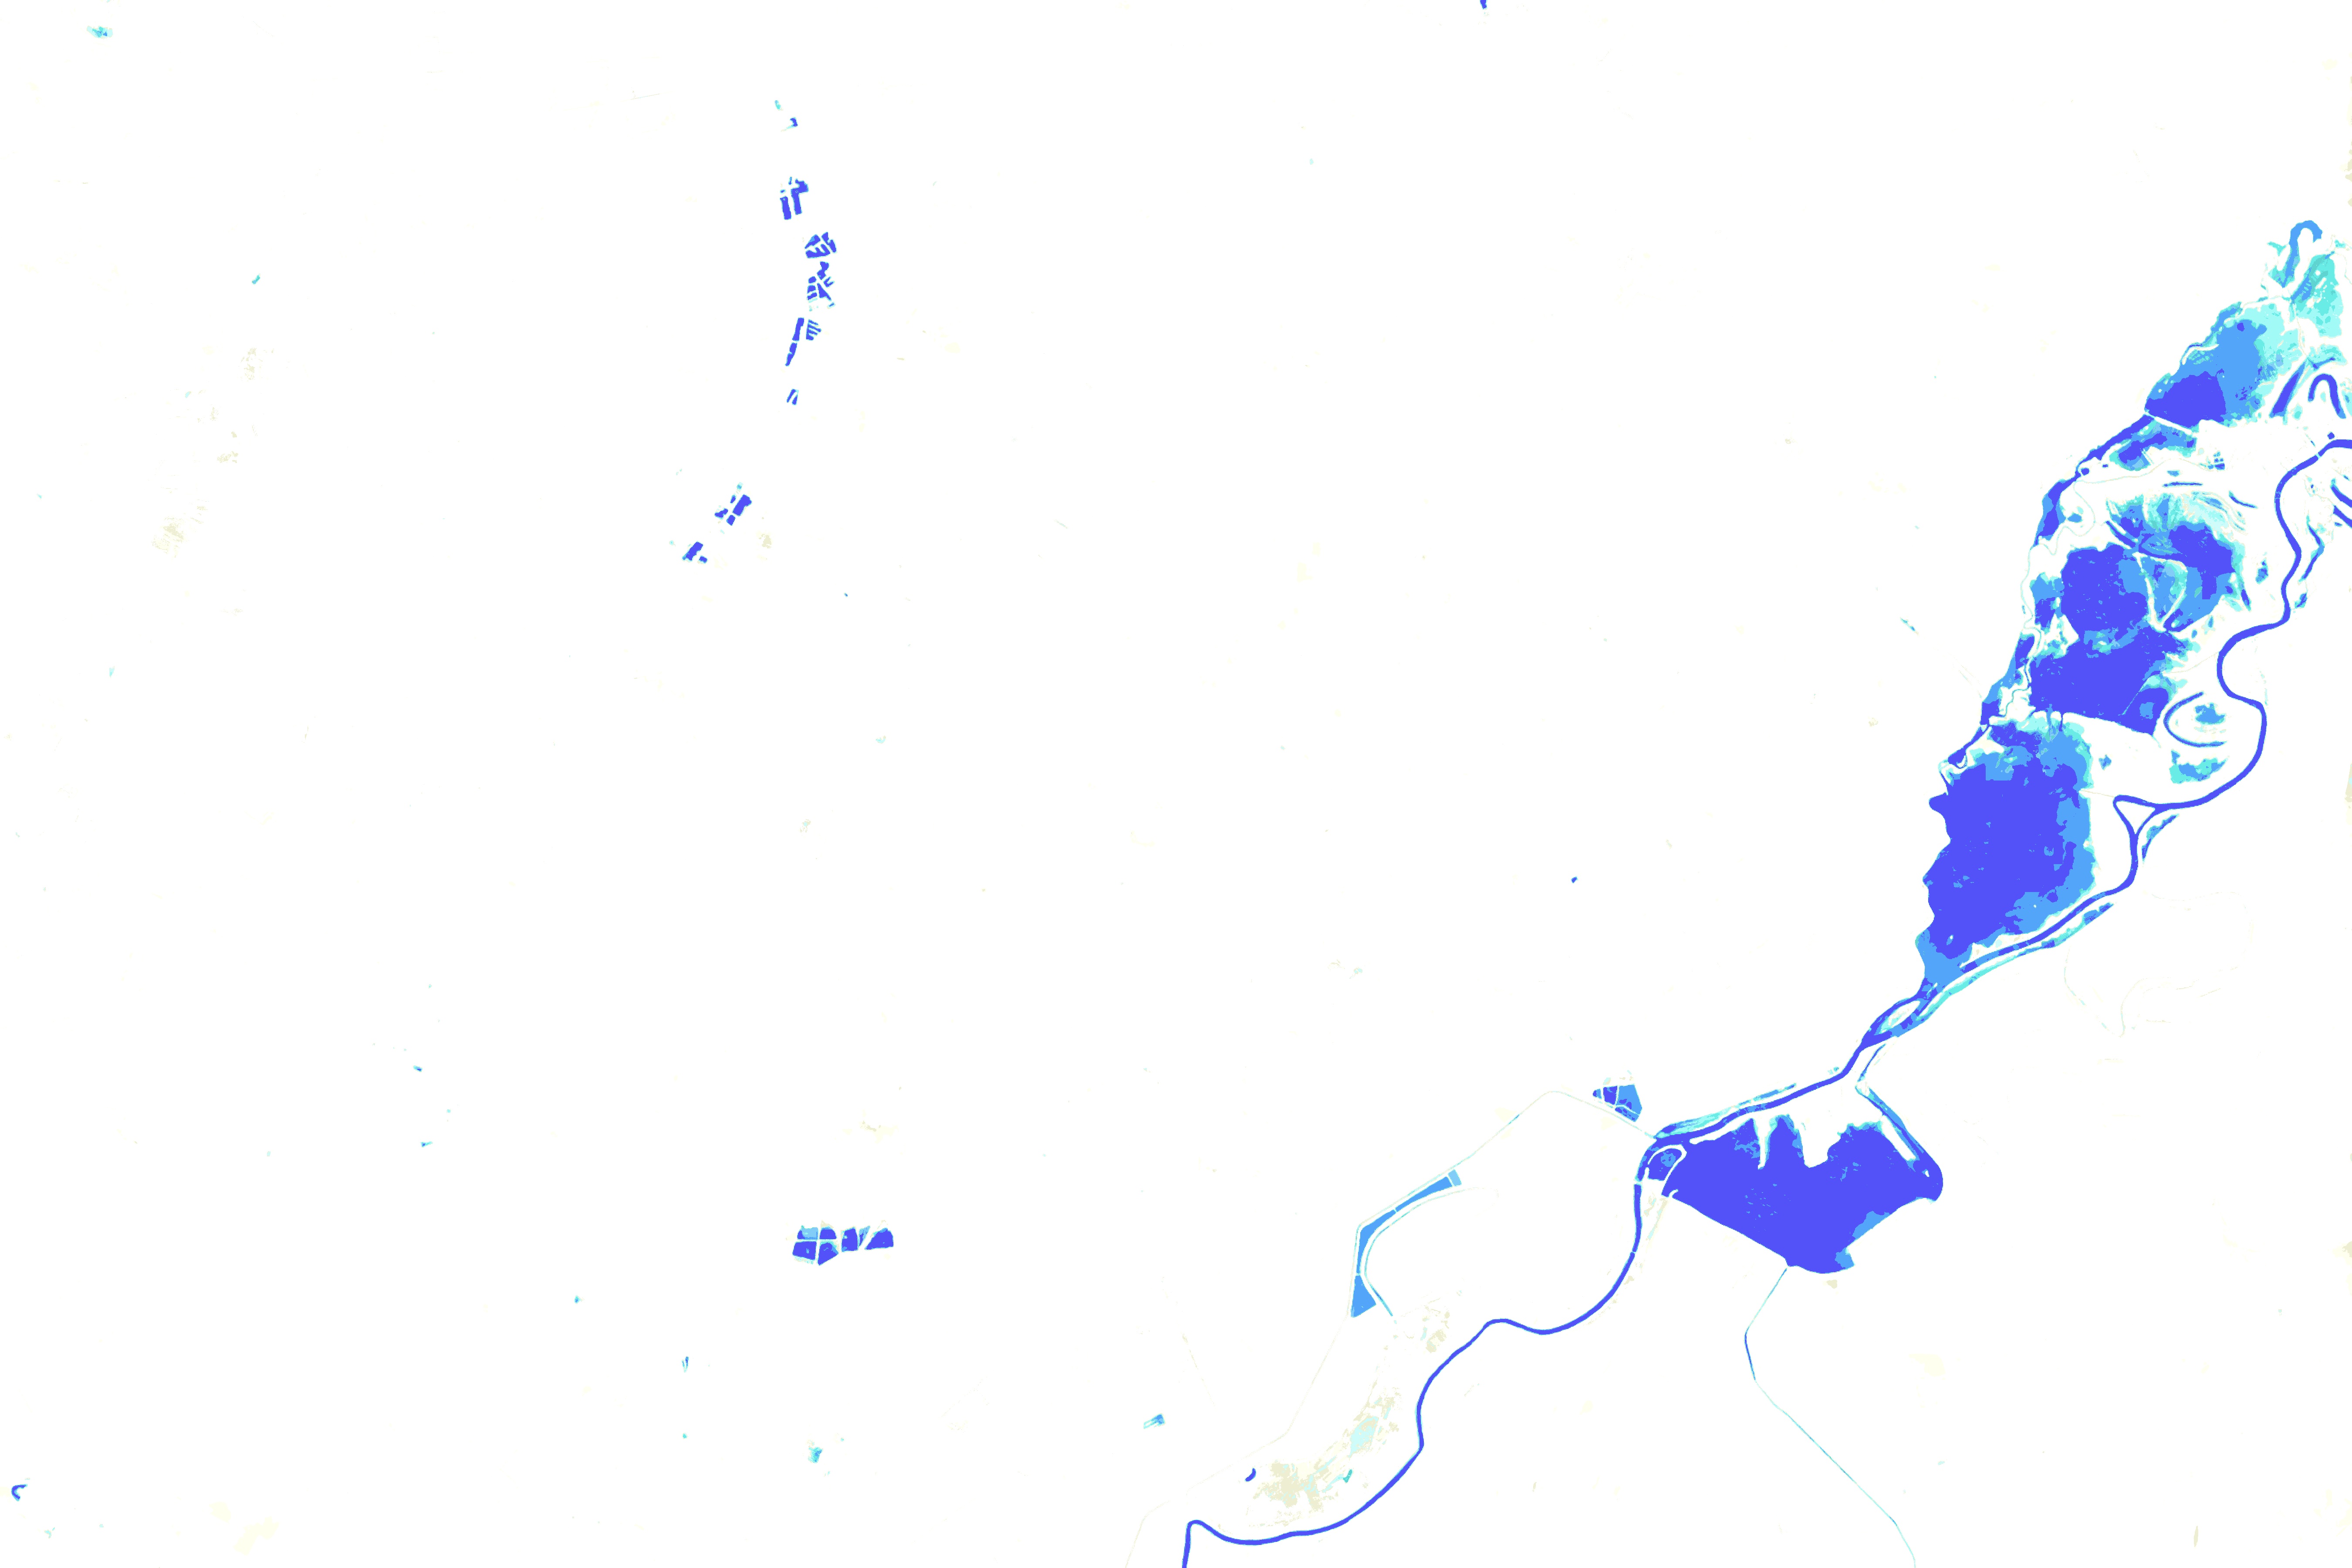
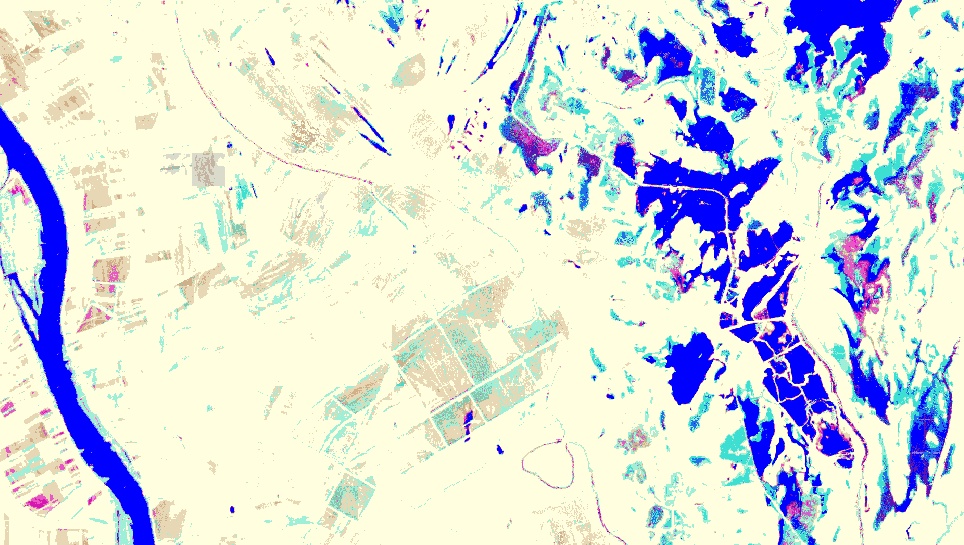
Ours
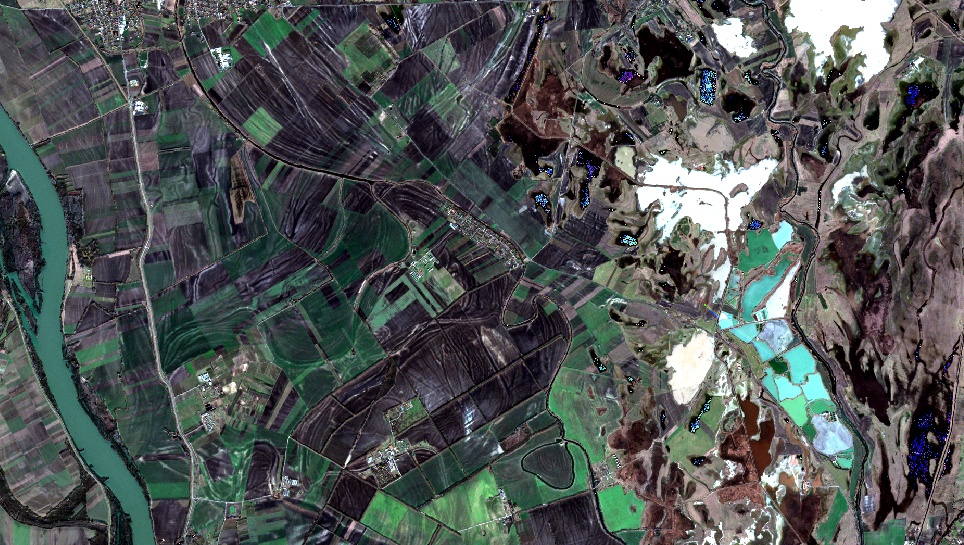
input Spain (RGB)
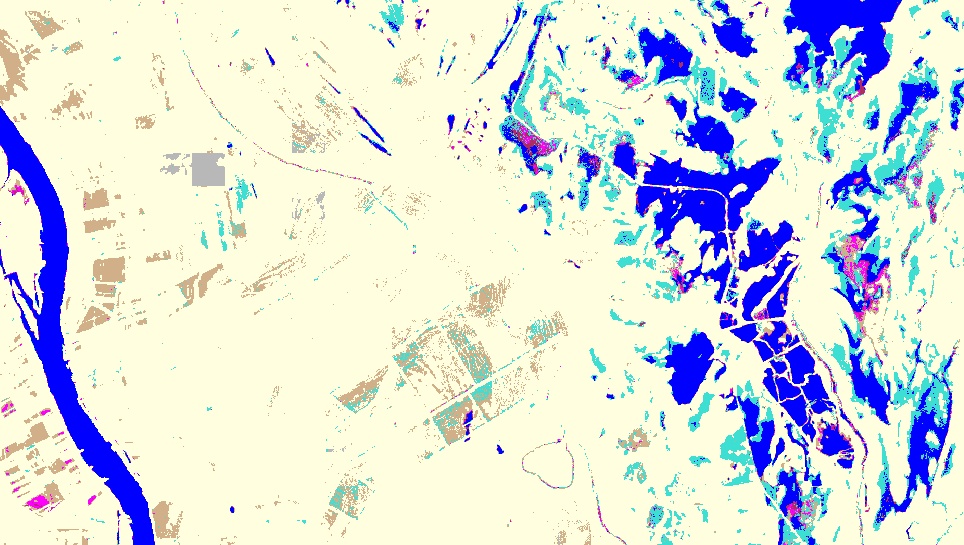
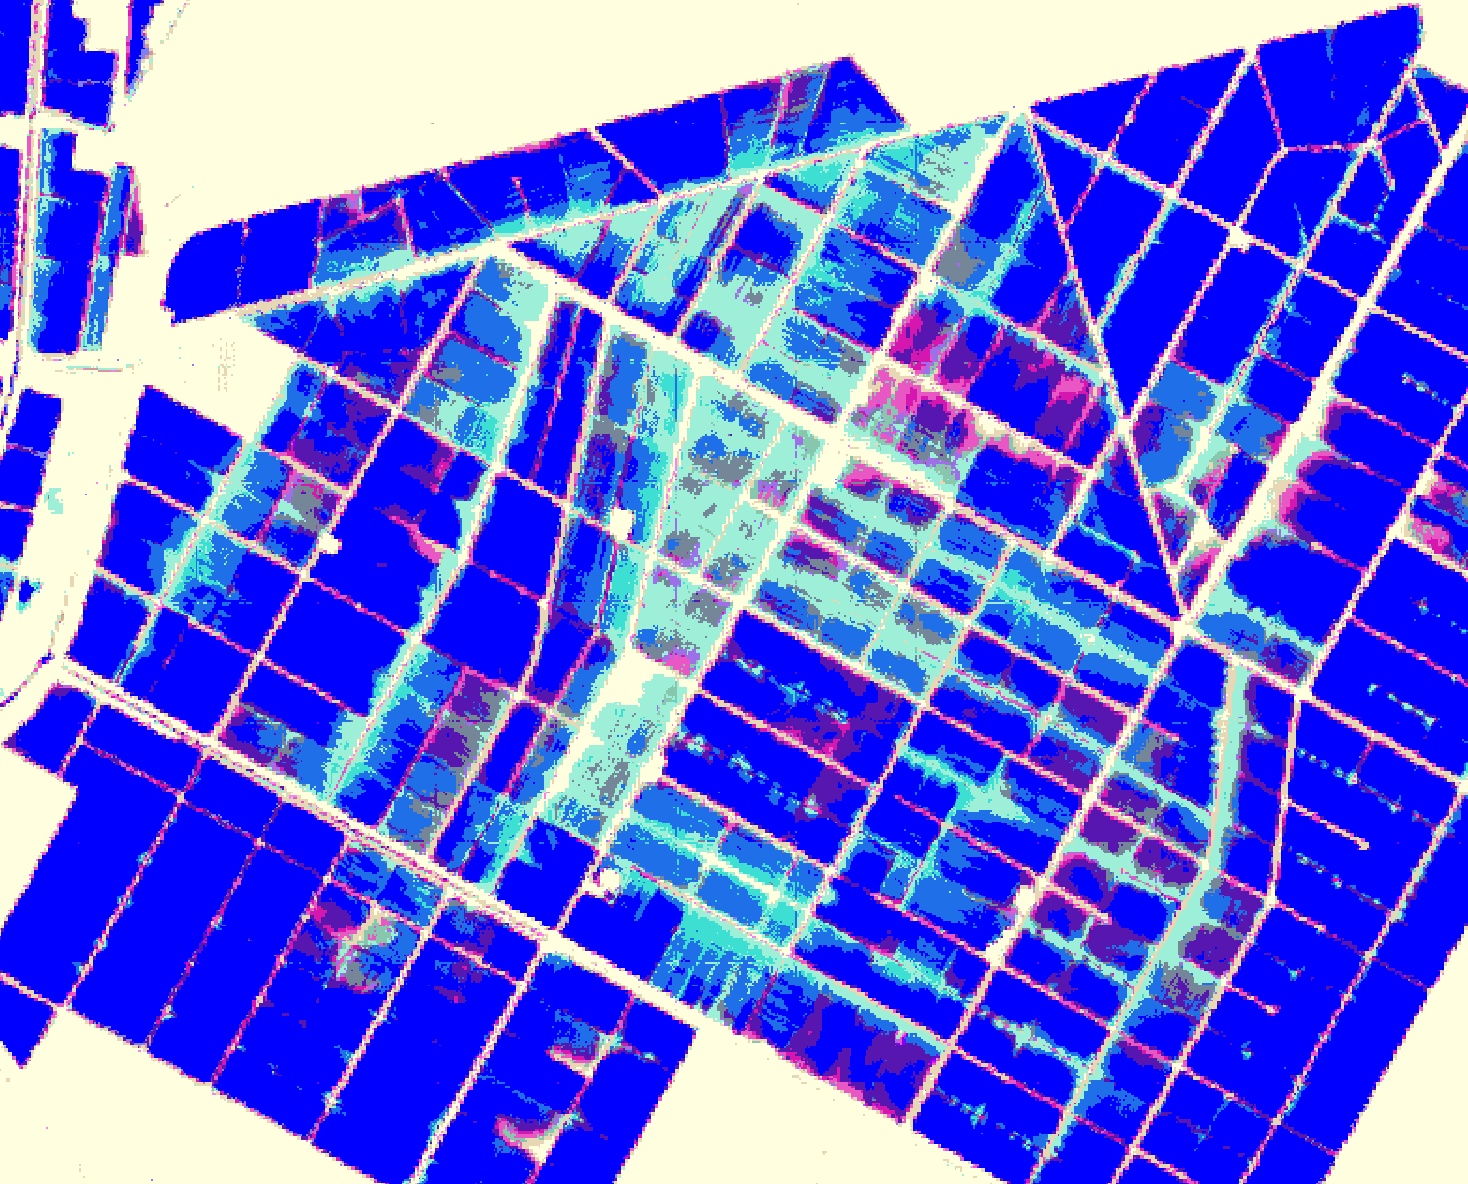
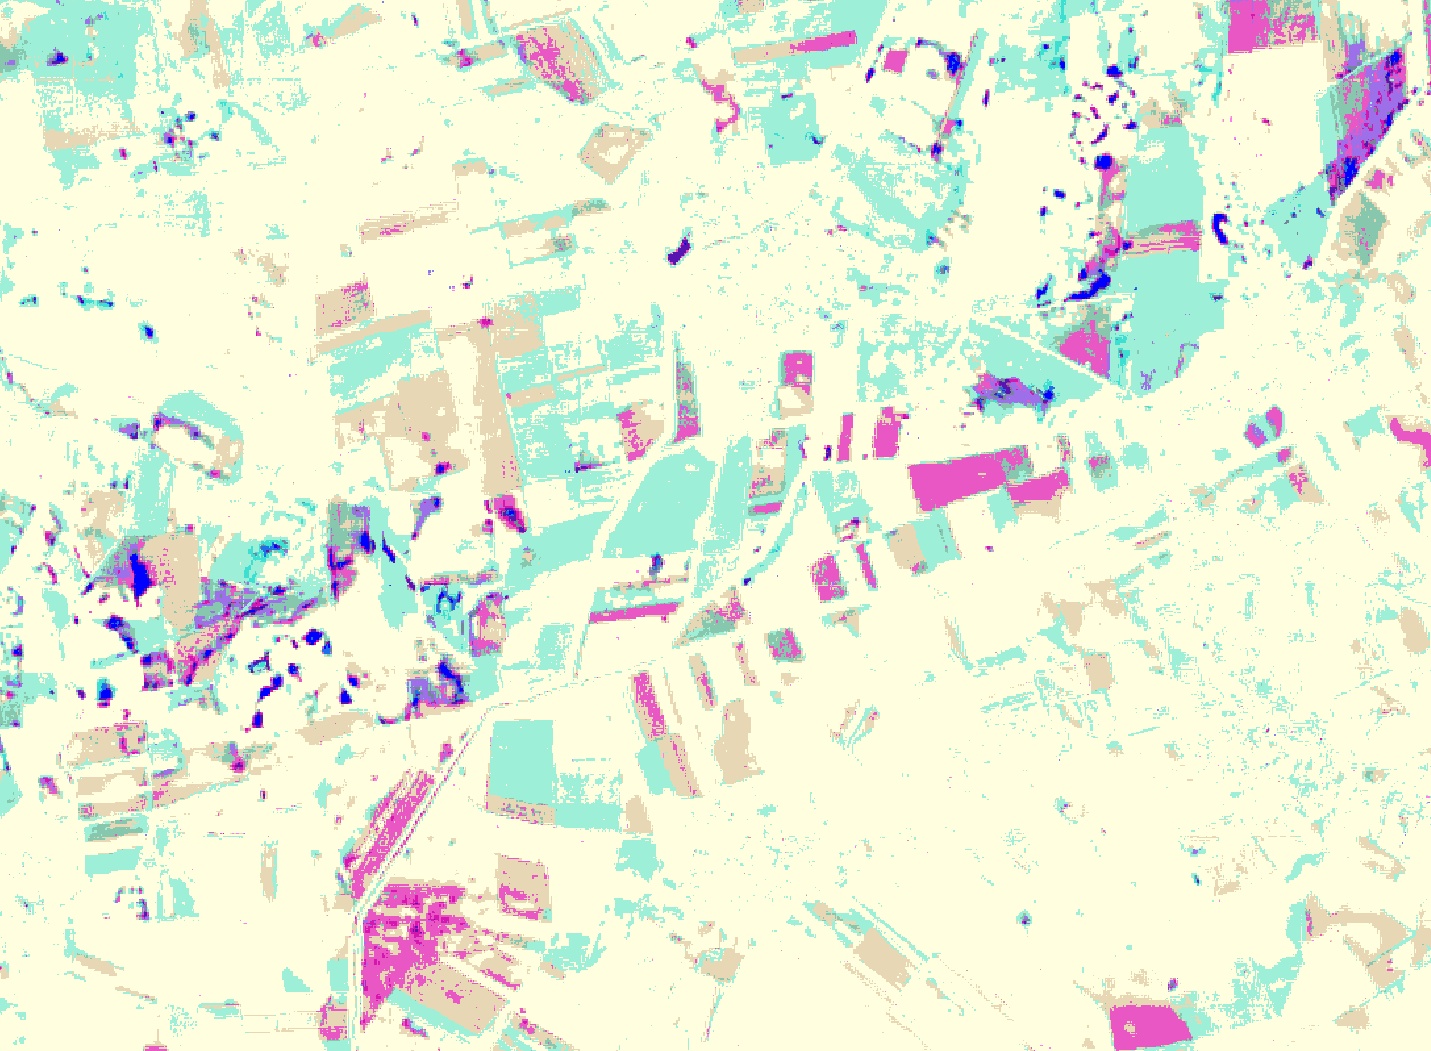
Ours
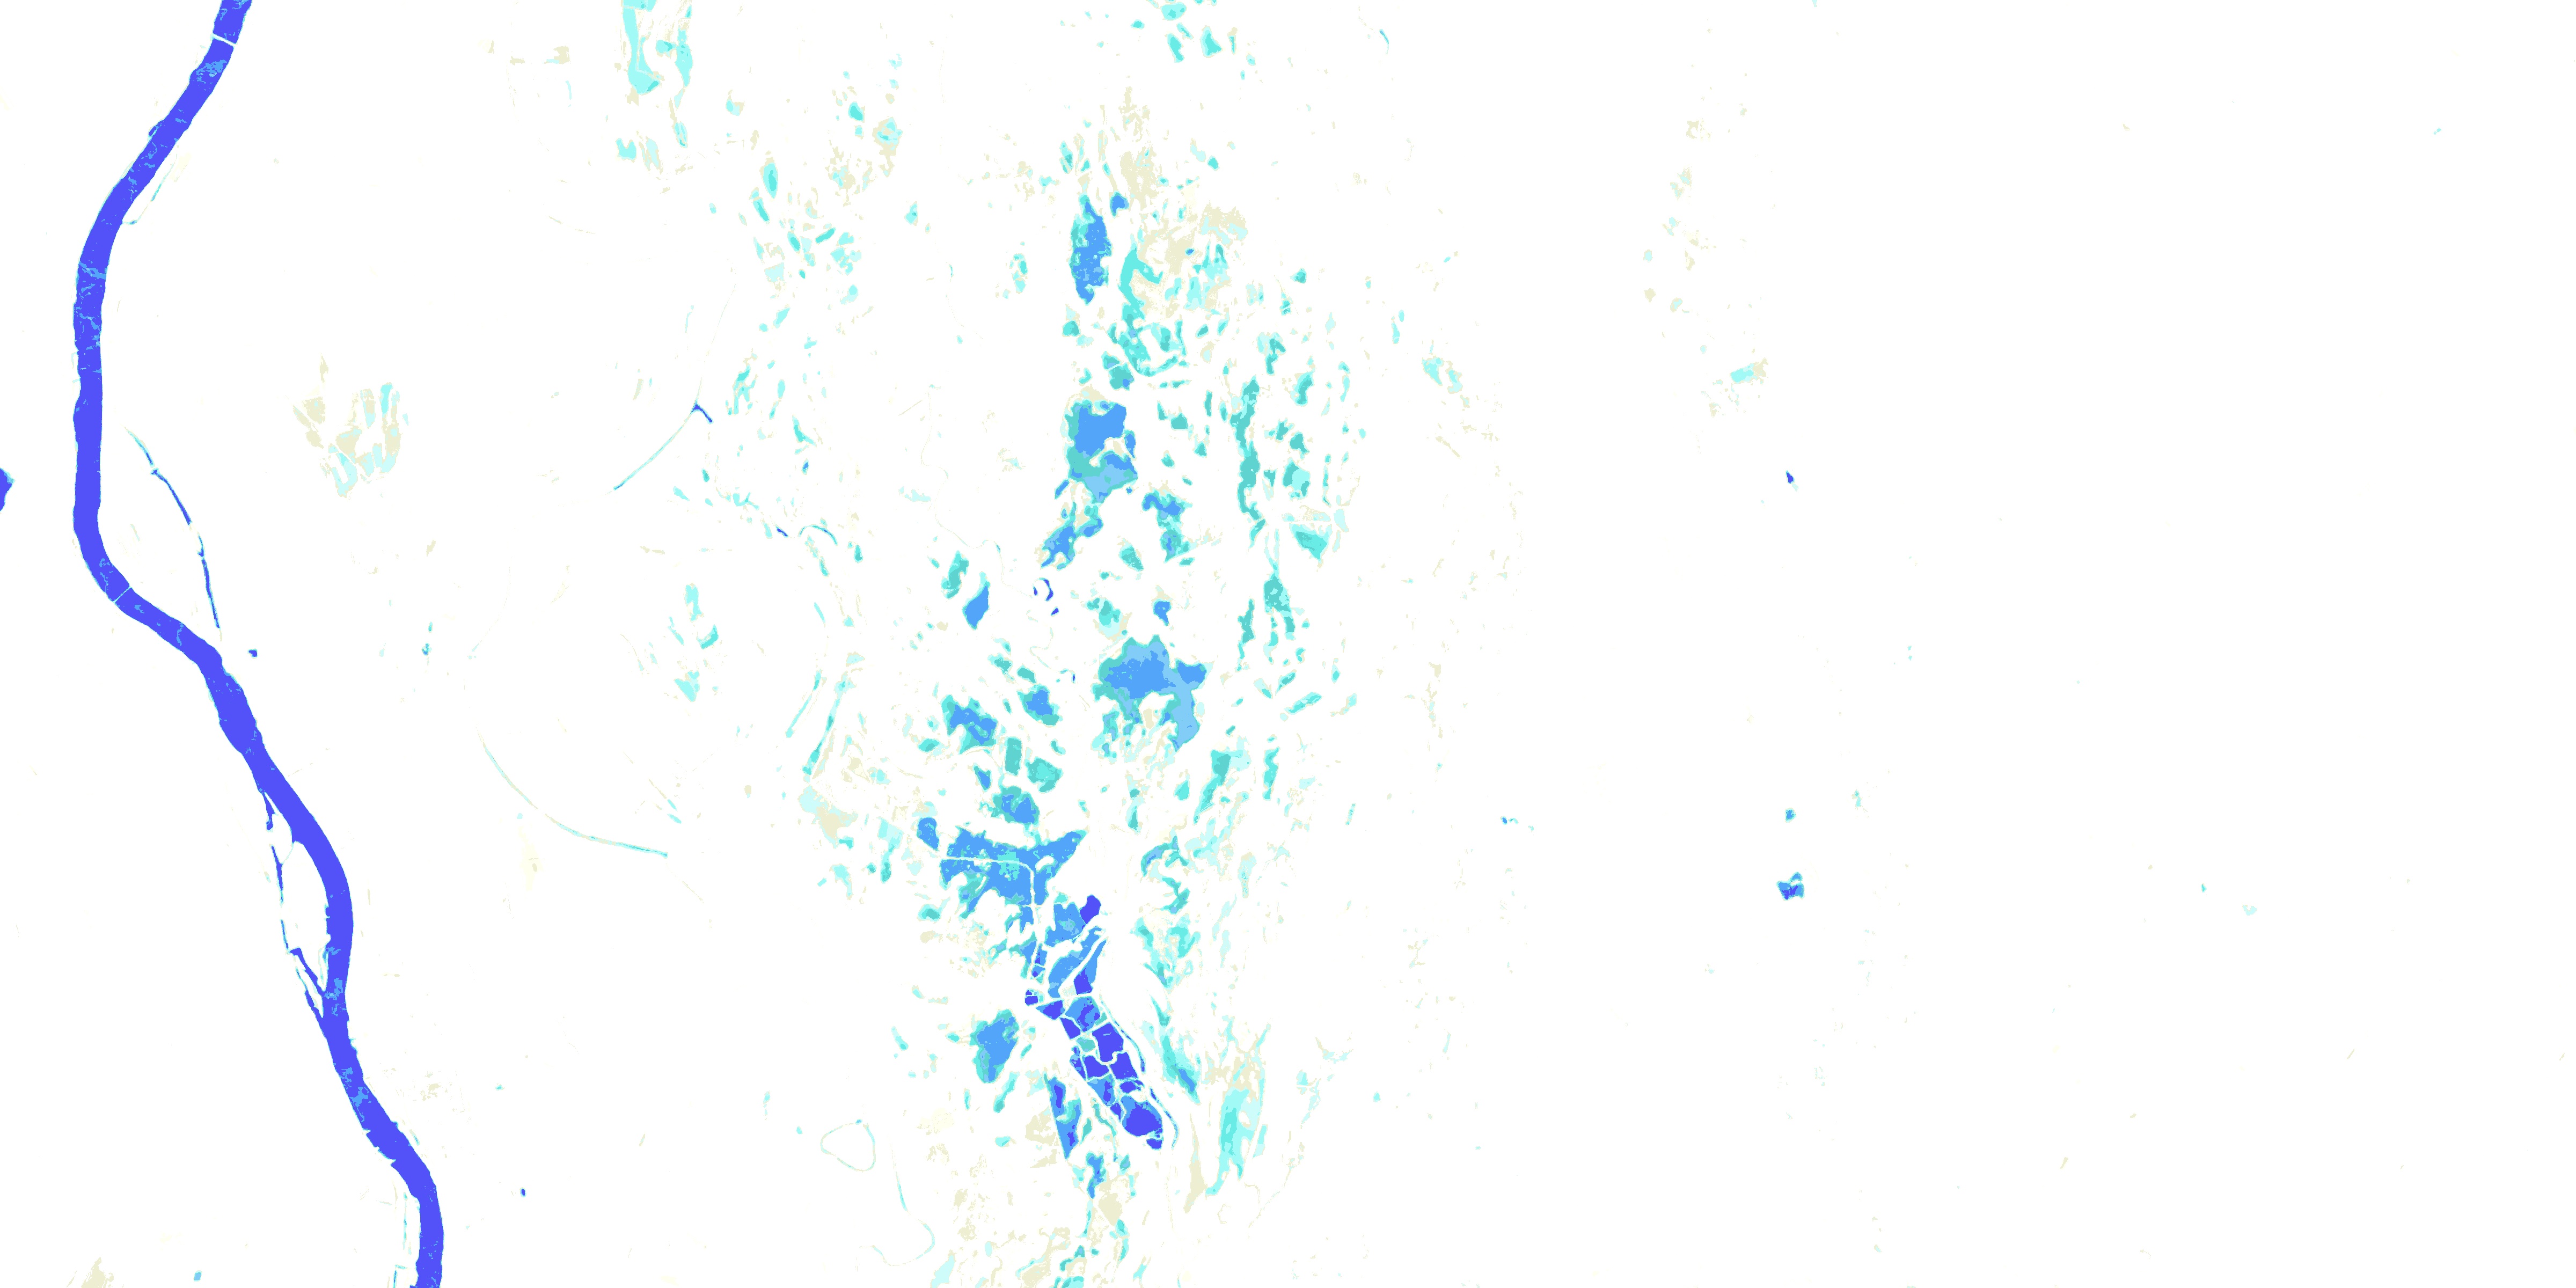
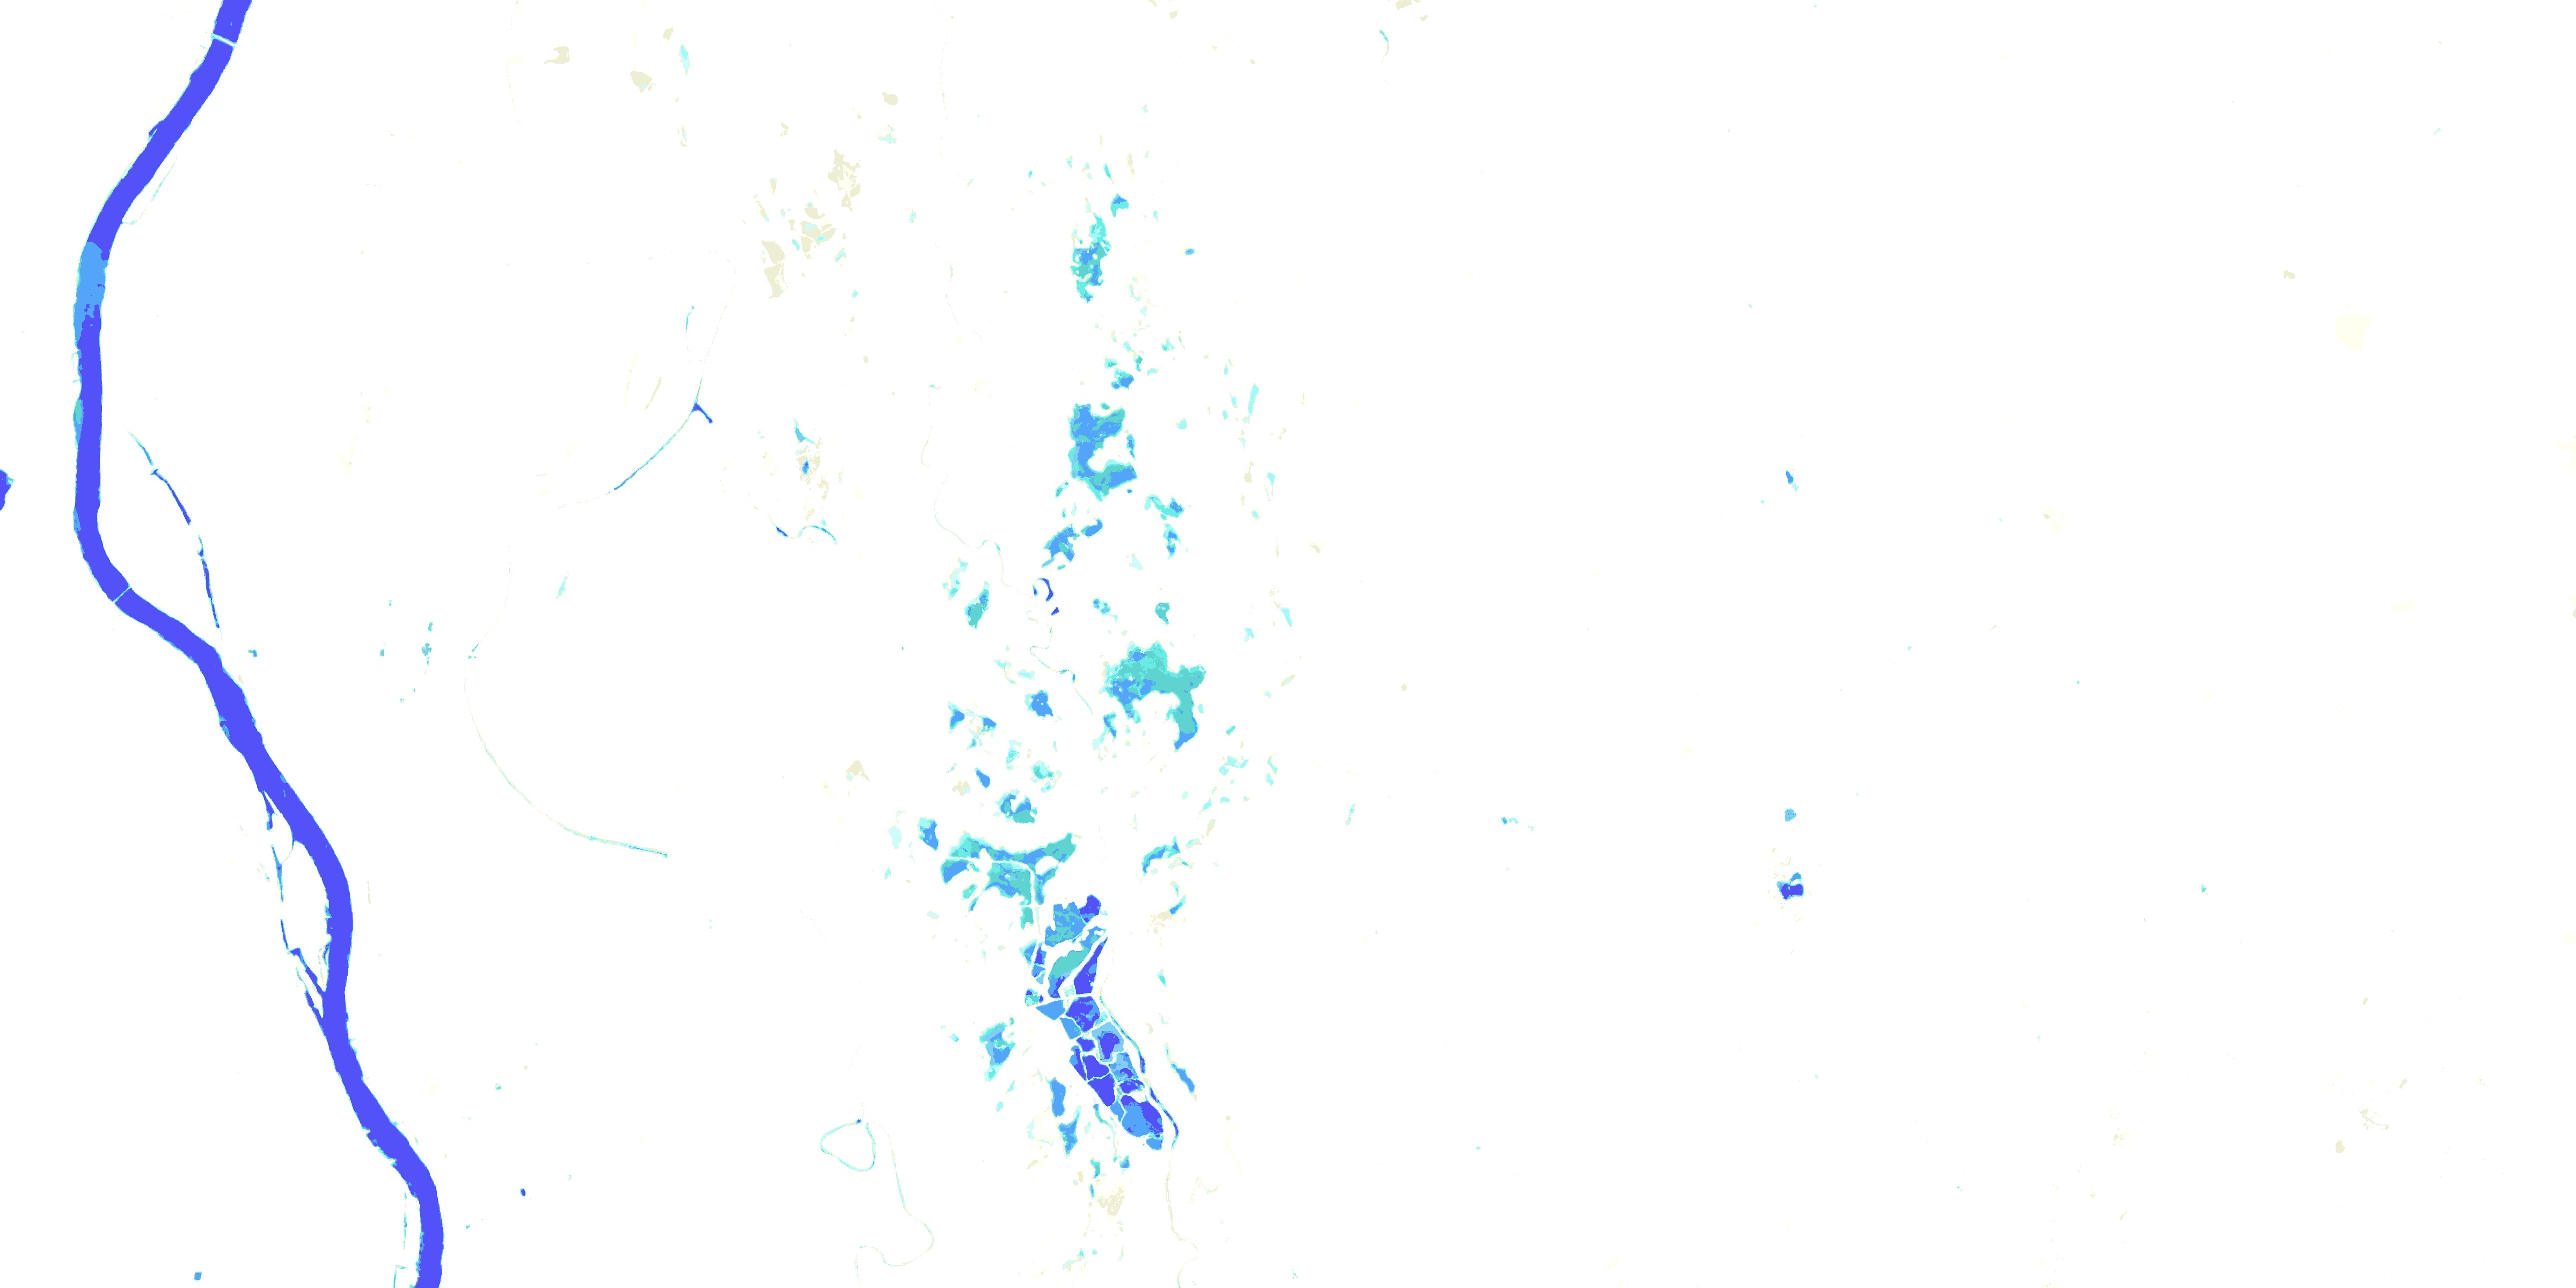
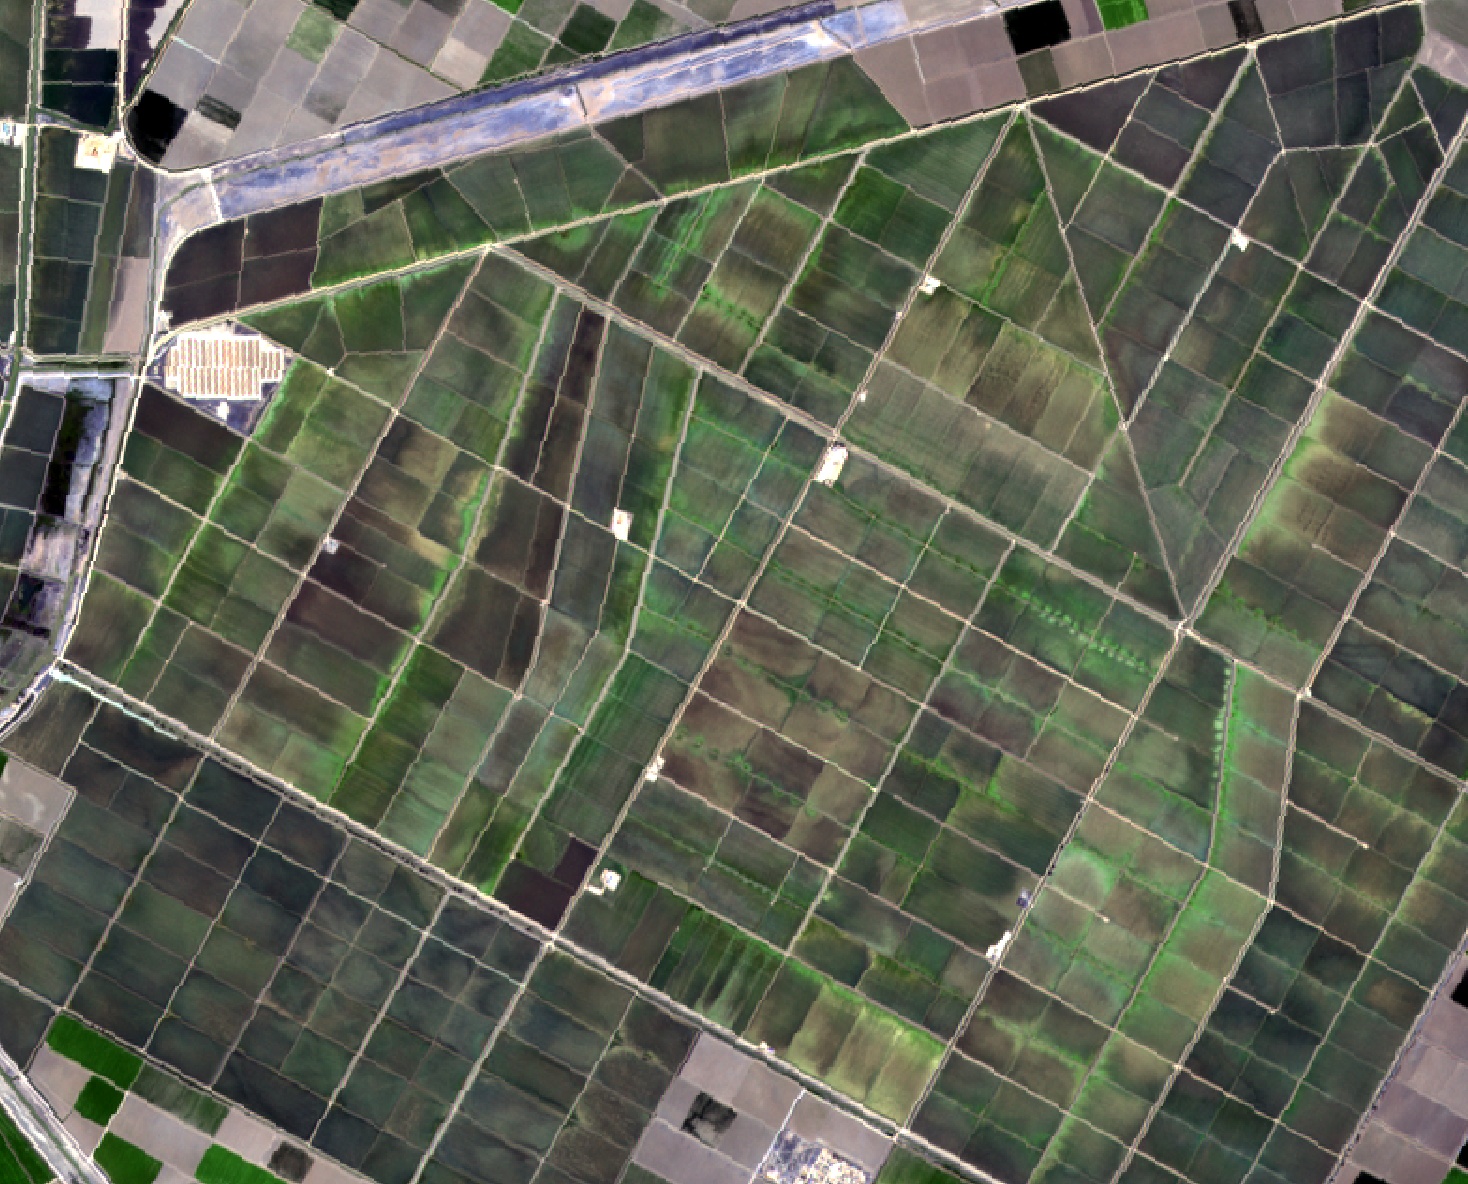
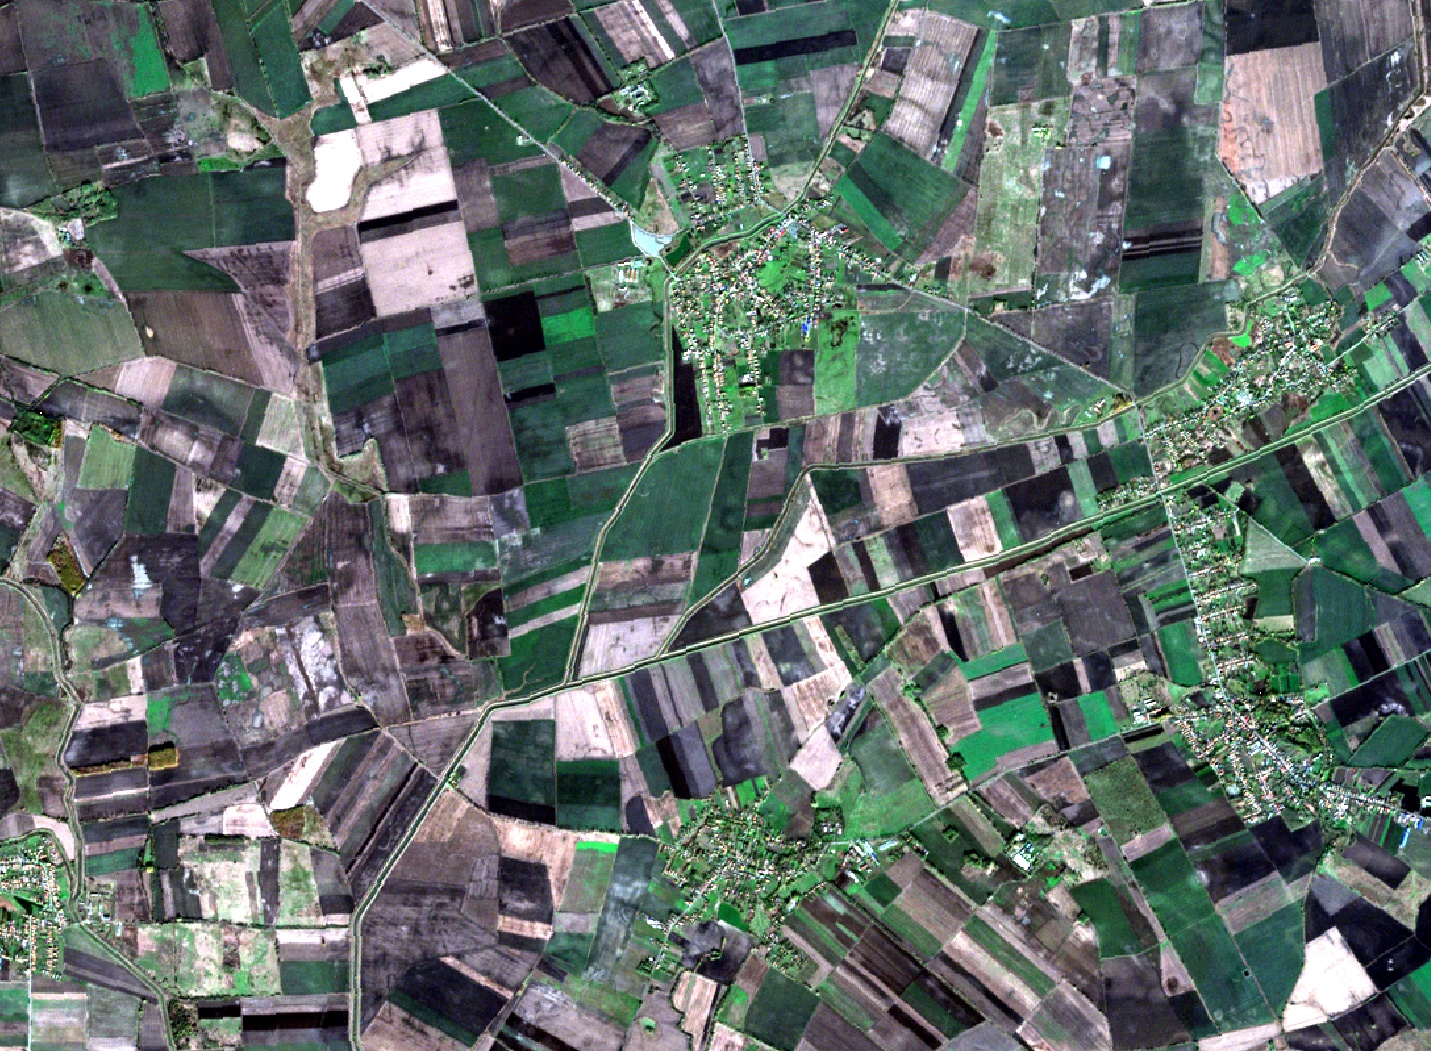
input KNPI (RGB) 2024-04-29
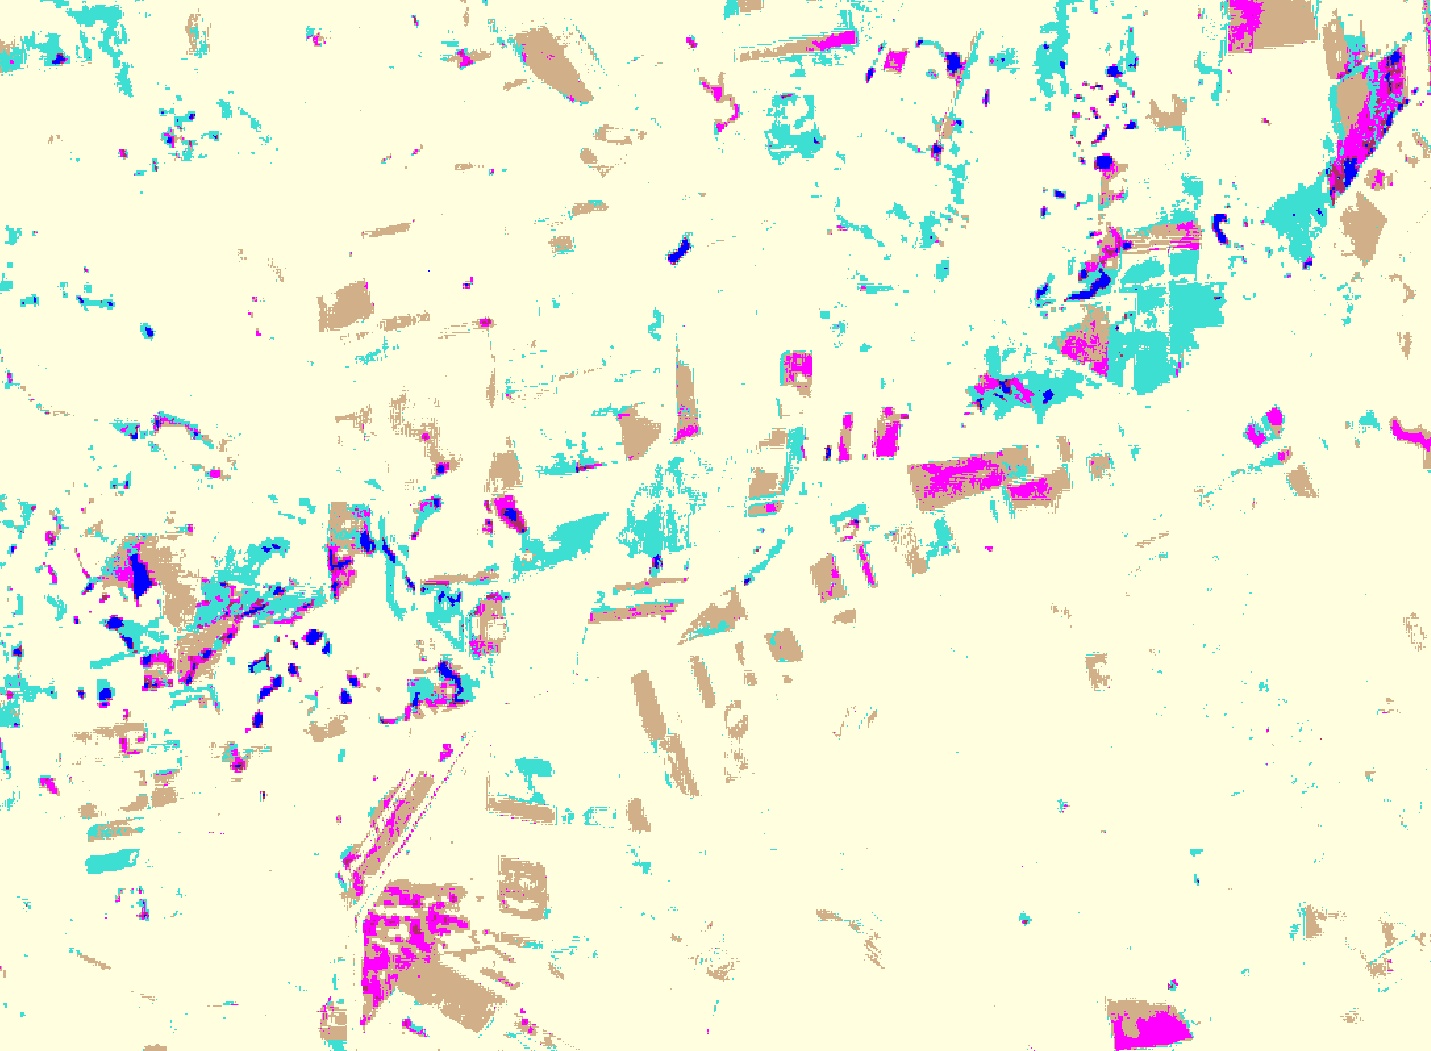
Ours
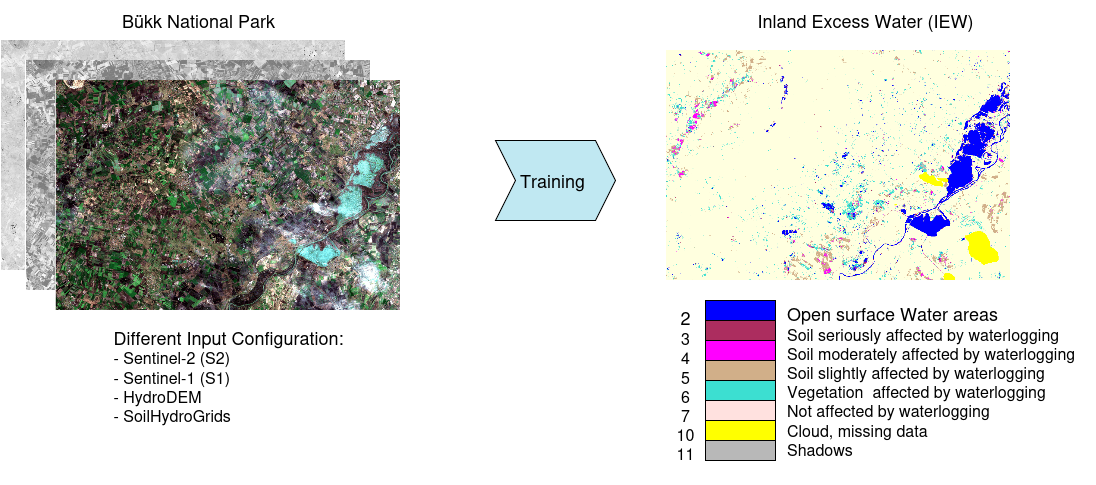
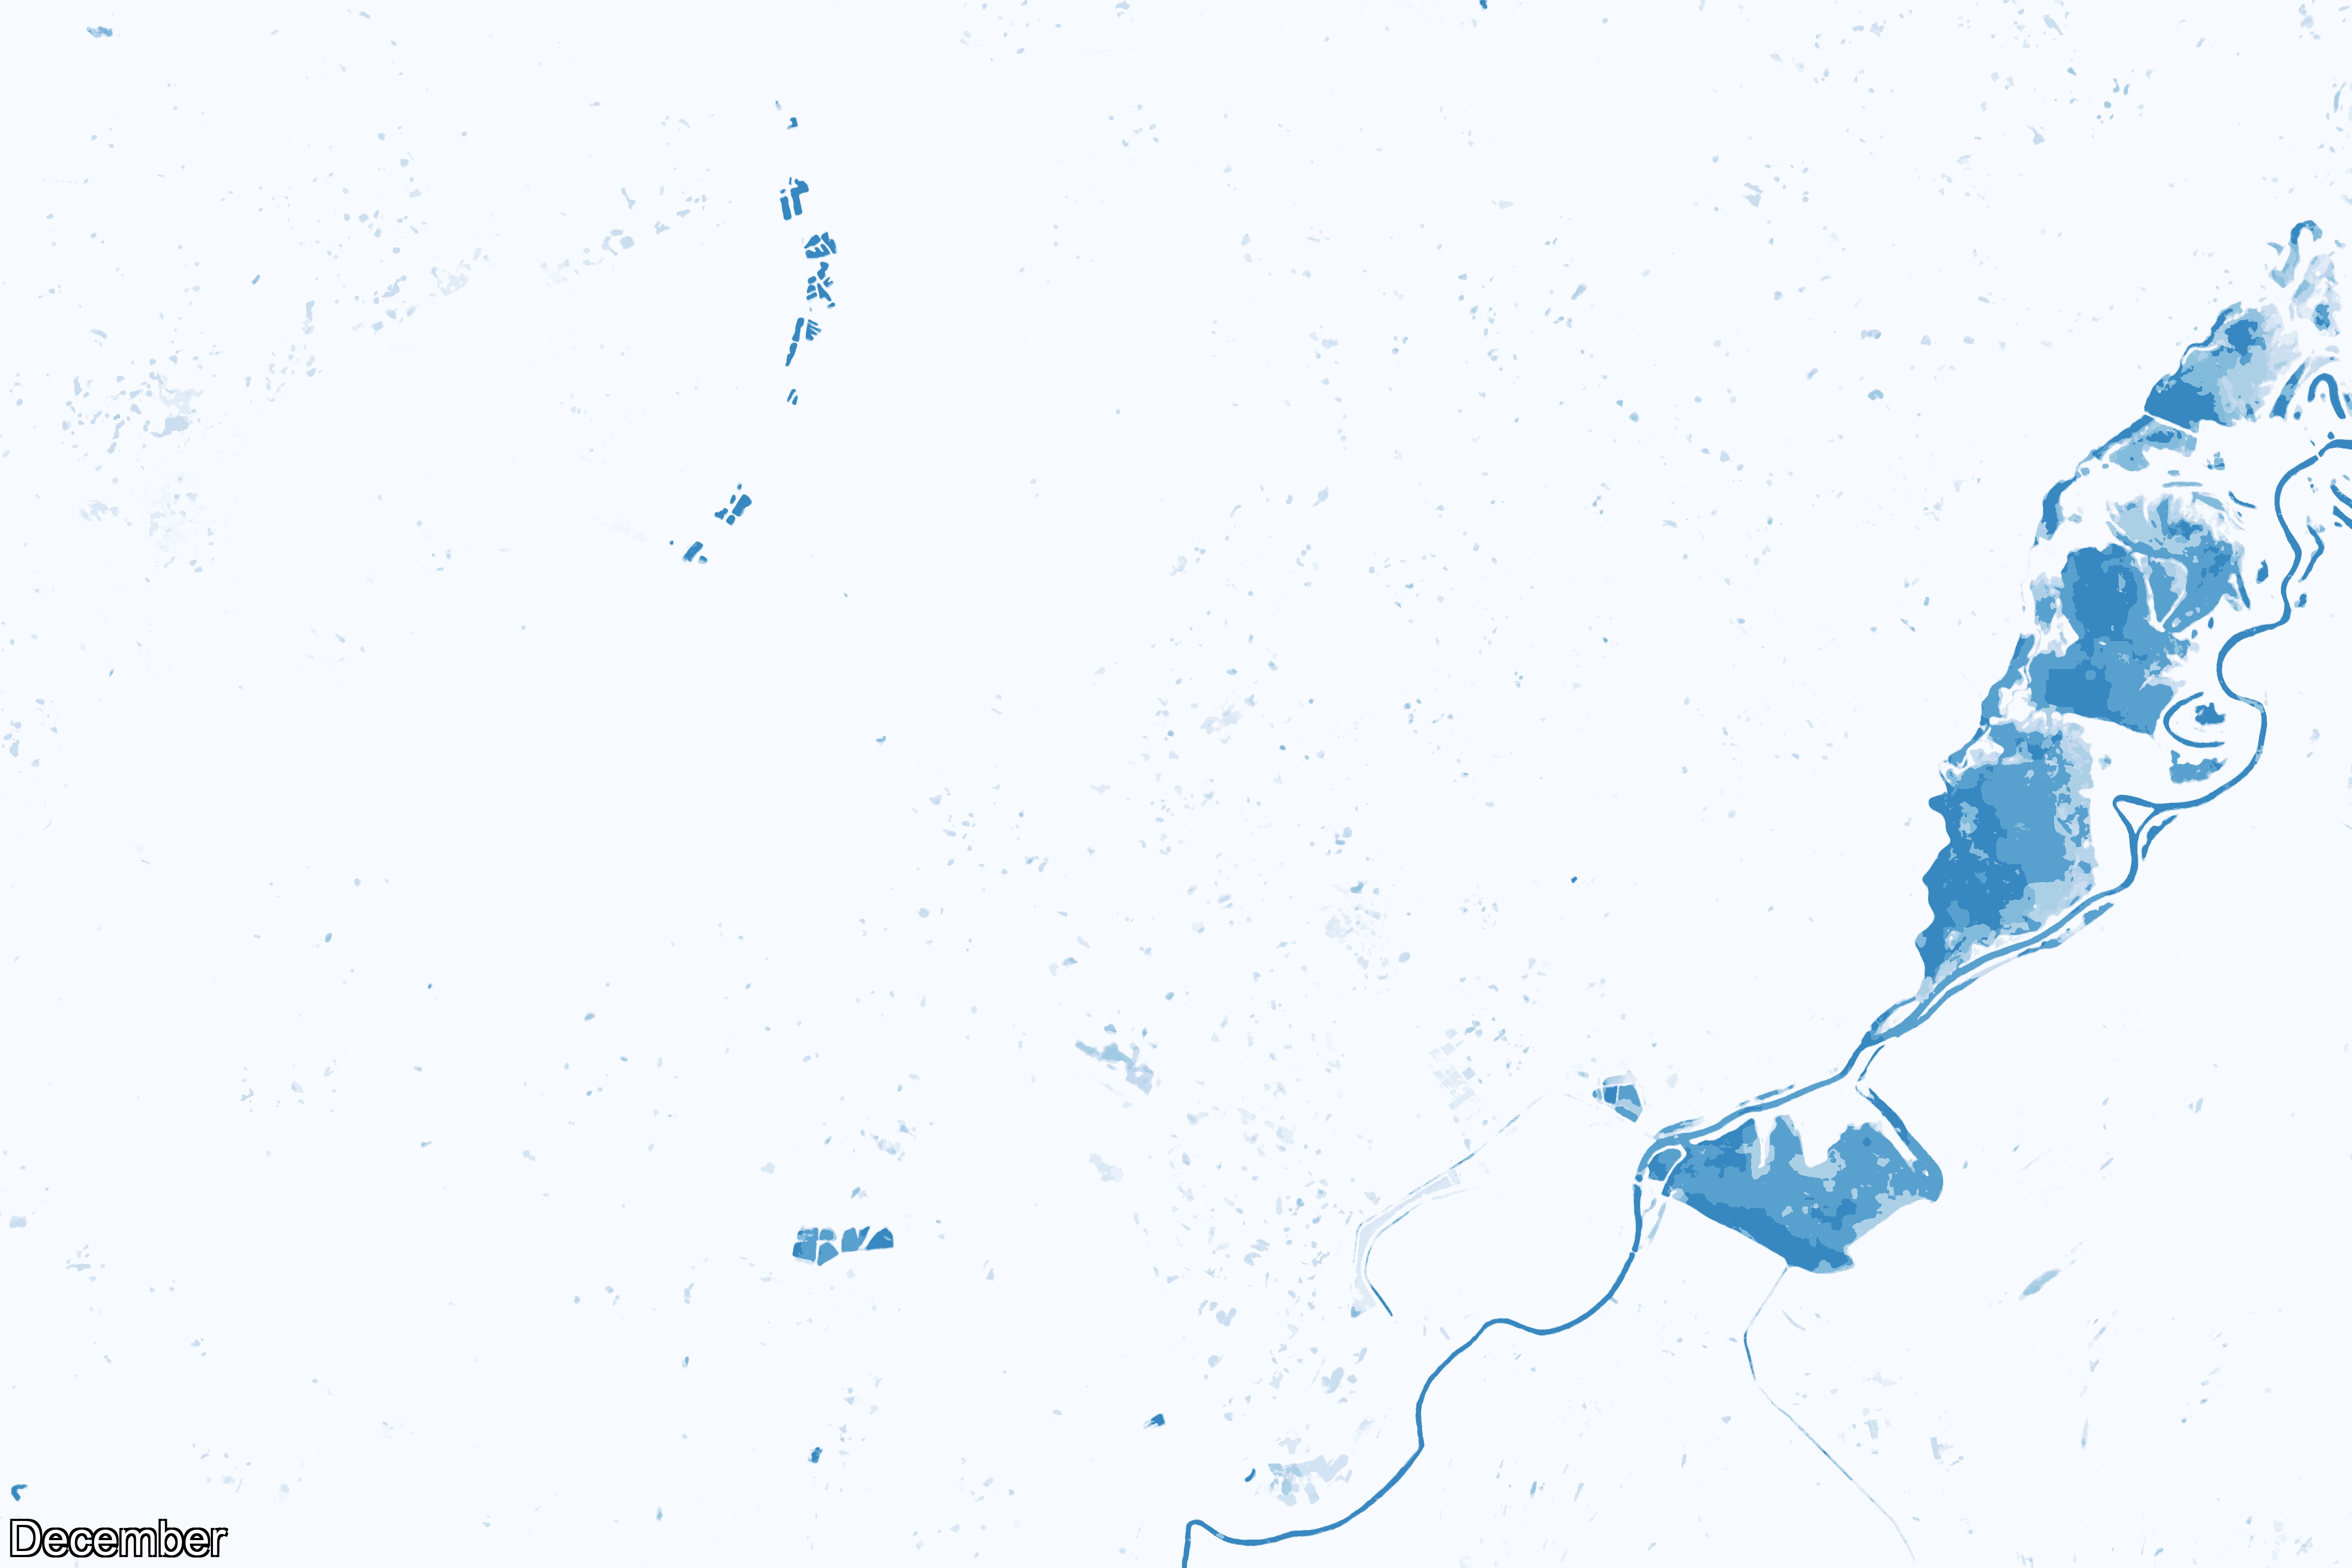
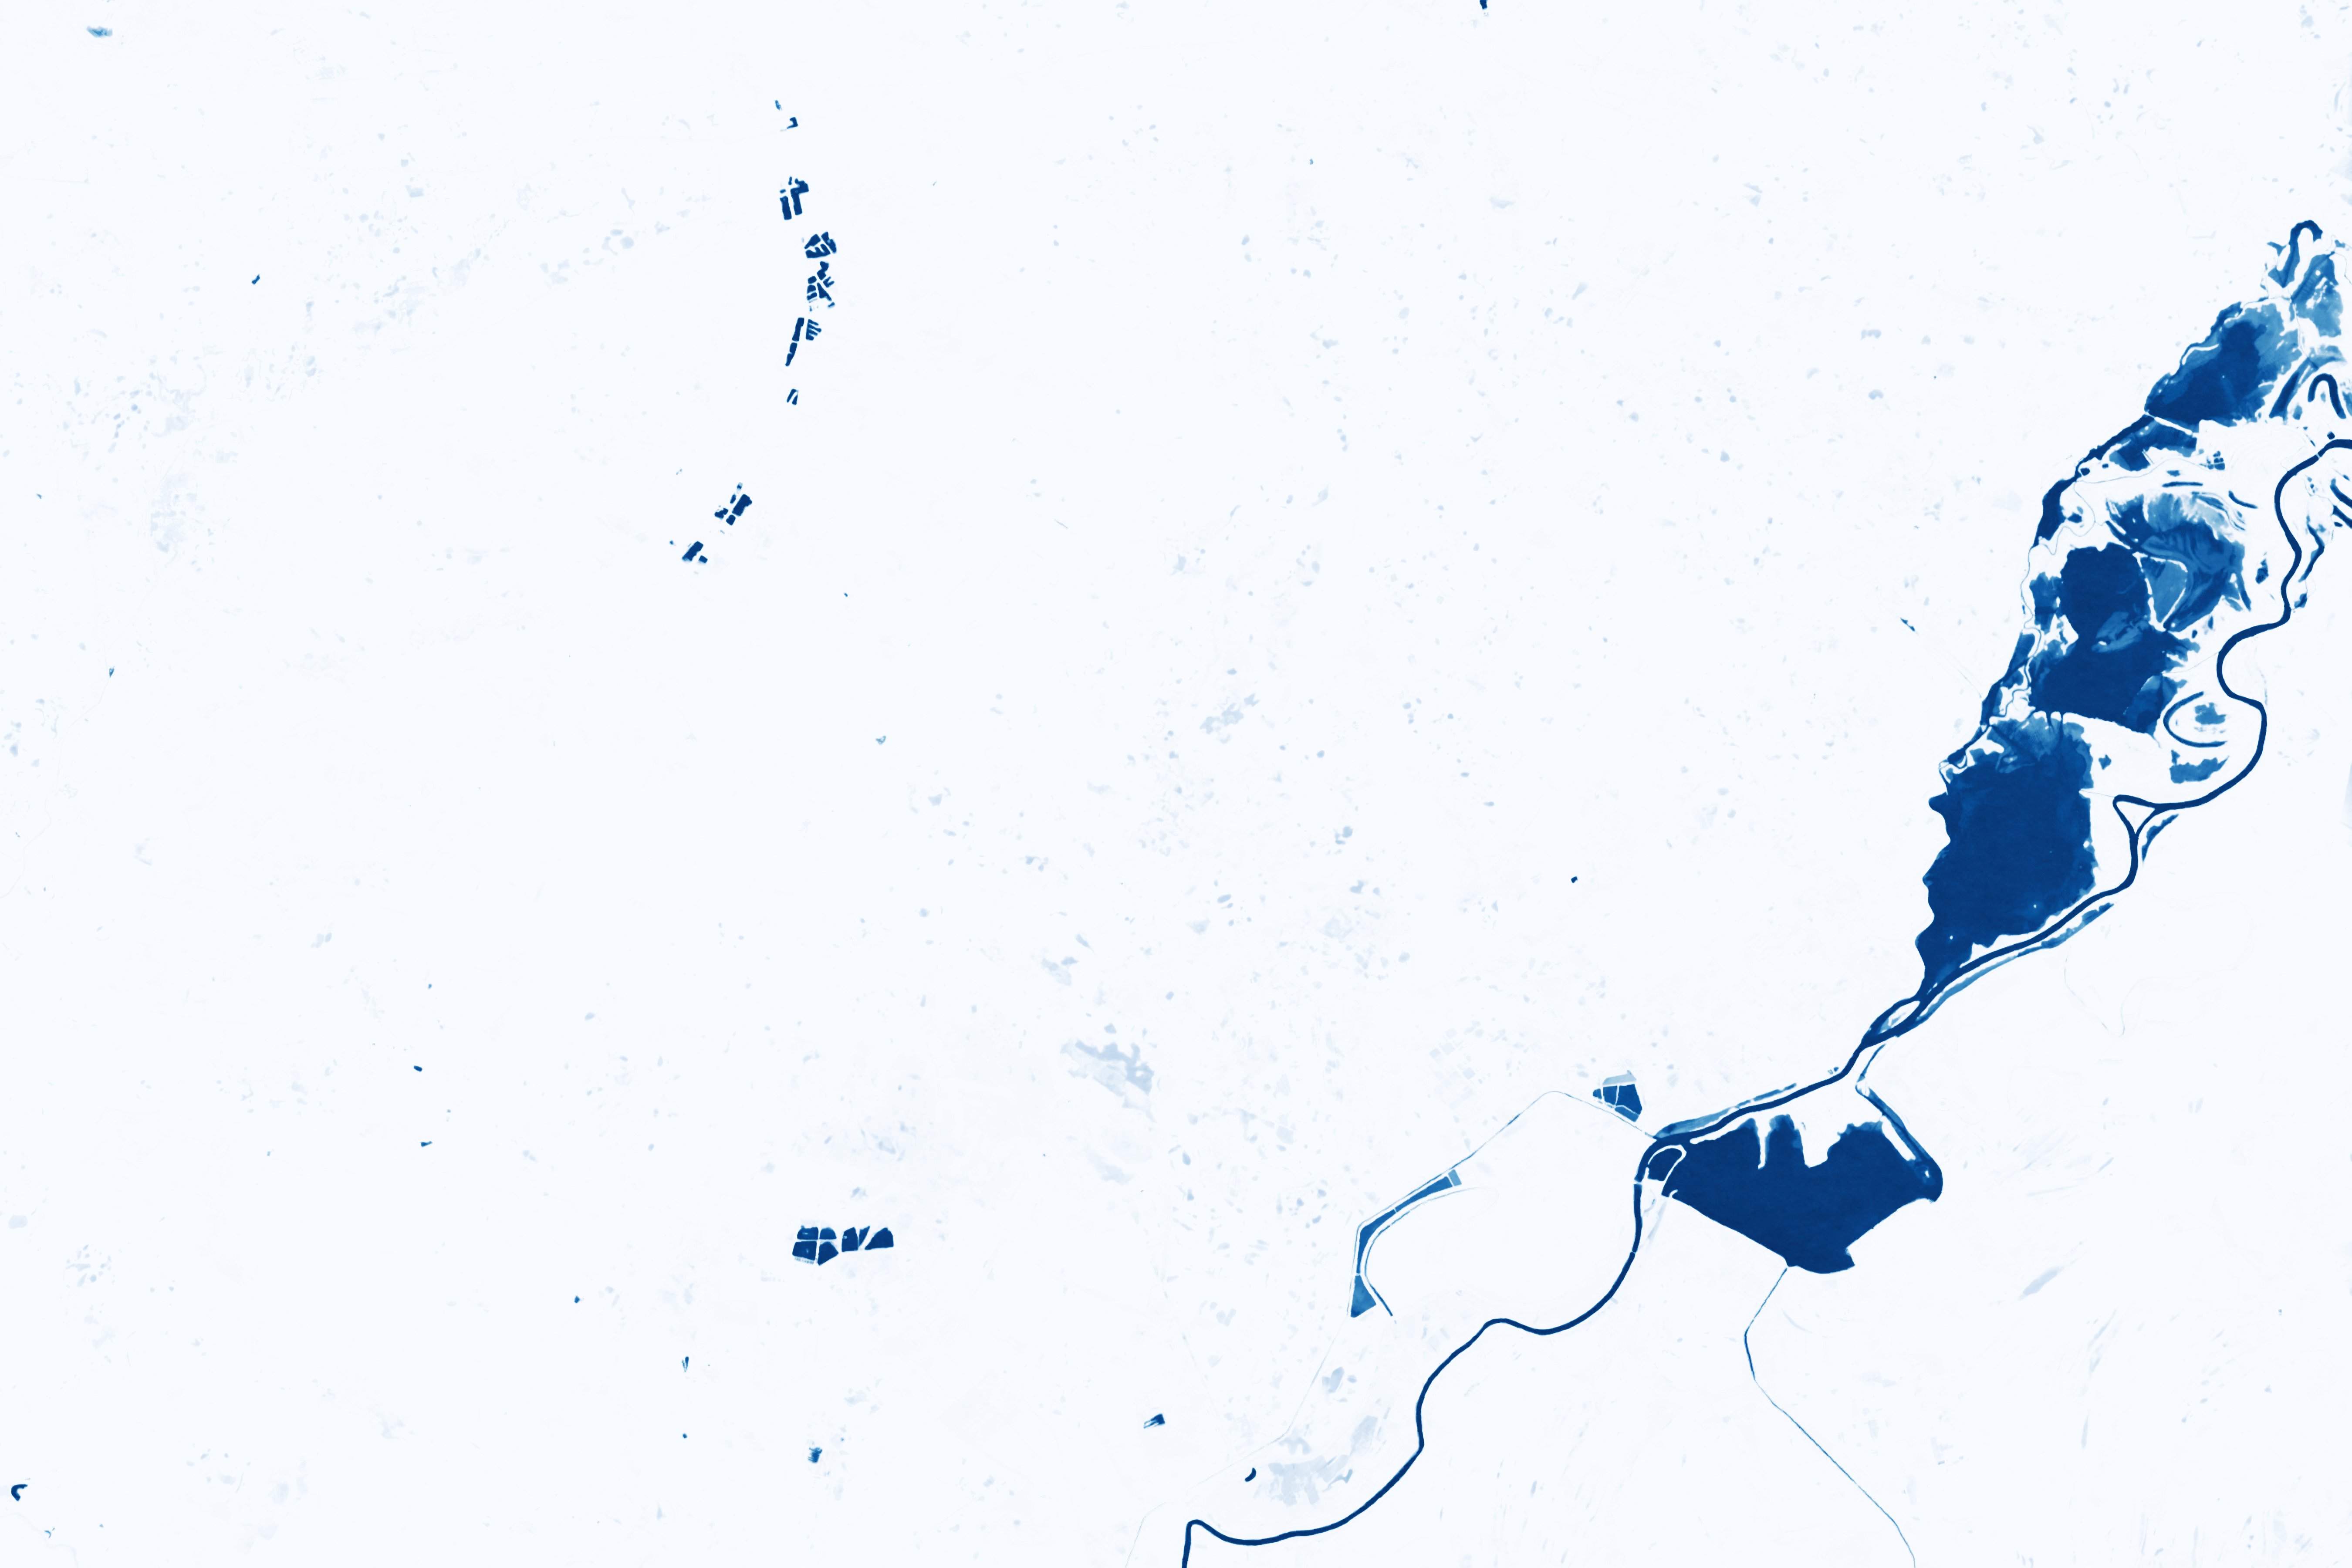
input BNPI (RGB) 2023-11-25